Graphs
Use graphs to visualise your data over time.
Creating a graph
Navigate to the graphs page via the button on the dashboard, or via the main menu.
Expand the Create Graph tab and select your options to get started.
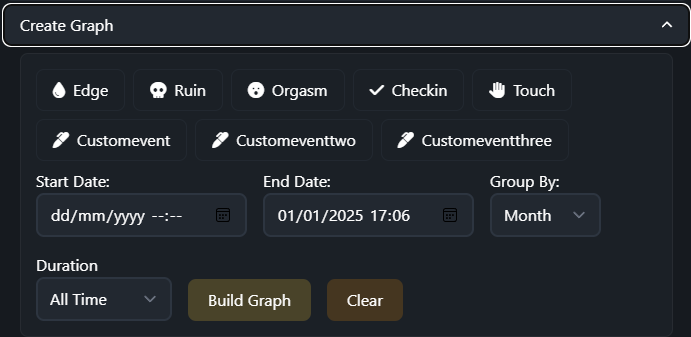
- Type
- Select the types of events you would like to graph. Events you select will be included on a graph together.
- Start and End Date
- Select the period you'd like to graph.
- Duration
- Choose a duration to automatically set the start and end date.
- Group By
- Events will be grouped and counted by this period. For example, choosing 'Day' will count the number of chosen events each day.
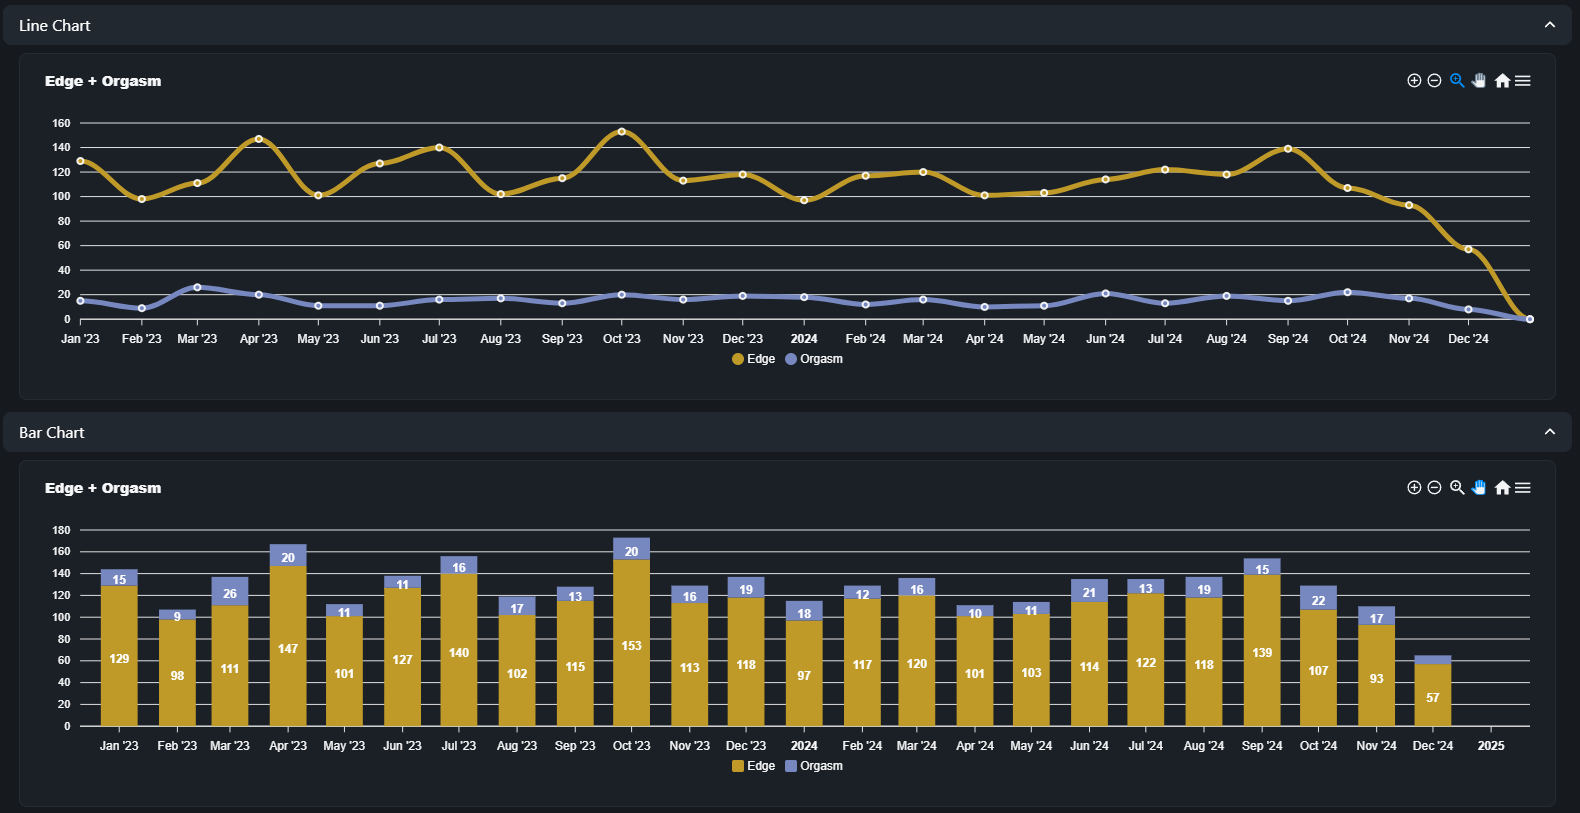
Viewing Graphs
Your graphs will appear below, and can be interacted with in a few ways.
Saving Graphs
Expand the saved graphs menu at the top of the screen to view saved graphs or save new ones.
When you customise a graph, you can name it and save it in this menu. To retrieve the settings, simply select it from the dropdown.
To delete a saved graph, select it from the dropdown and use the "Delete" button.
Themes
Different colour themes are available for your graphs. Use the arrows or dropdown in the top right of the screen to switch between them and download your graphs in any of them.